
American Prime uses satellite data and AI to deliver precise, real-time insights for agriculture, oil & gas, and carbon monitoring. Their platform focuses on empowering farmers to get a clear, quicker picture of their crop health to reduce risks and create better outomes for their growing season.
They came to us with a very early stage platform that needed a clear, usable foundation and appearance so they could test their assumptions with farmers during their beta phase.
American Prime
Agri-Tech
Beta SaaS
Product Management, Product Consulting, Wireframing, Architecture, Prototype, Design System, UI, Development Documentation
It was unclear what users could even do on the product or where to do
Their current product was missing workflows and logic needed to get robust feedback from users
The UI made it difficult to interpret the data given

The problem
Farmers lacked visibility into how individual fields were performing. While data existed, it wasn’t tied to anything concrete or familiar, making it difficult to translate metrics into real, actionable decisions.
What we did
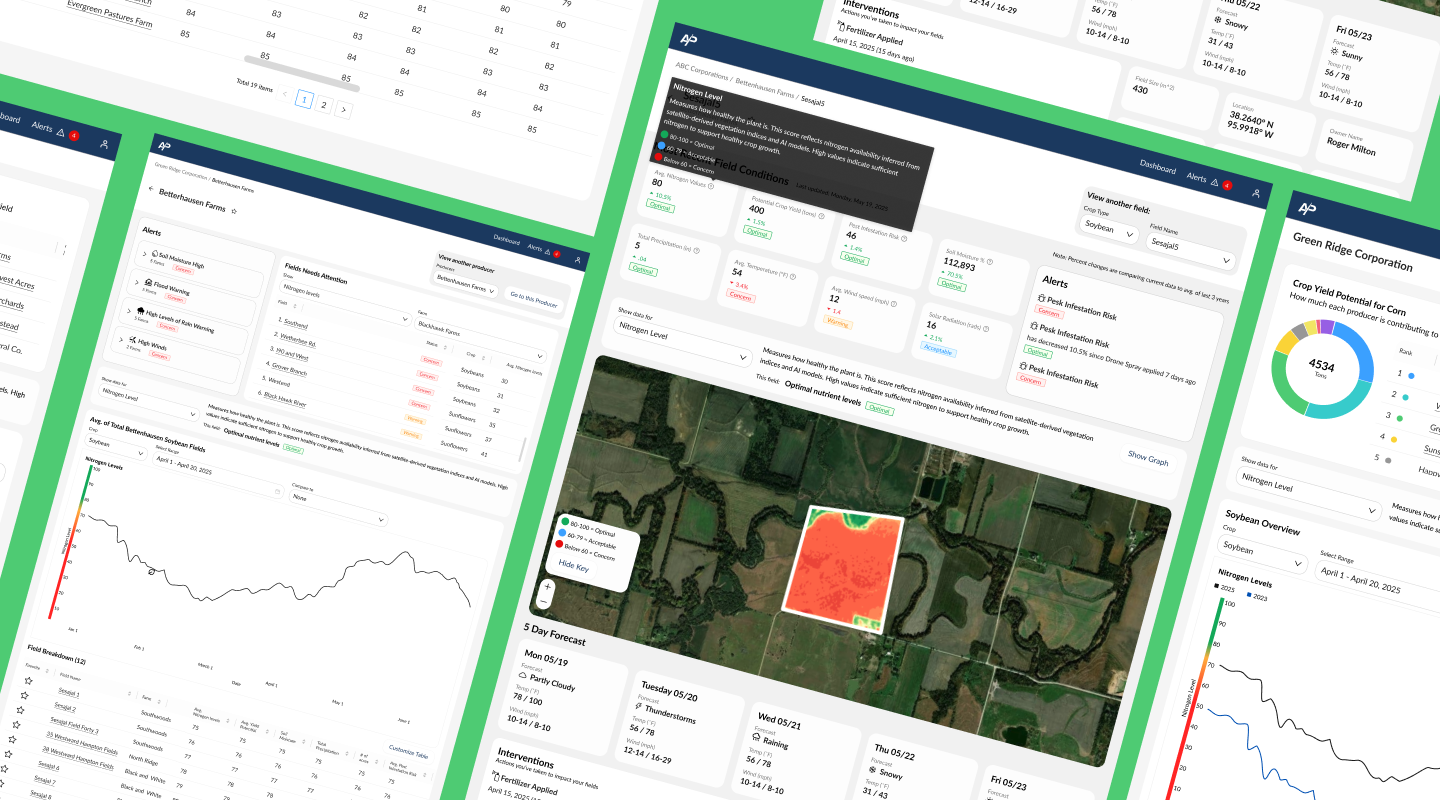
We created dedicated field-level pages that allow farmers to drill down into the specific conditions, performance, and needs of each field. By pairing this data with satellite imagery, farmers can clearly see how key values map directly to their crops and land.
Why it mattered
Connecting data to familiar field-level context made insights tangible and actionable, enabling farmers to make more confident, informed decisions.
The problem
There are hundreds of data types and metrics that can be measured, but more data doesn’t automatically mean more value. Much of the collected data used clinical or technical labels that lacked real-world meaning for farmers, making it difficult to interpret and ultimately less useful.
What we did
We surfaced the four most useful data types farmers rely on to make decisions about irrigation, fertilization, and overall crop health.
Each data type includes tooltips that explain its meaning in plain language, along with reference ranges that indicate what levels are considered ideal.
We also added clear descriptions that explain what each data type represents and how it’s used, keeping that context visible when a metric is selected.
The map view uses satellite imagery to visually display the selected data type across the crop area.
Why it mattered
By grounding the data in familiar concepts and real-world context, the platform turned complex metrics into insights farmers could actually use to make decisions.


The problem
Corporate teams had no visibility in how all their farmers were doing
What we did
Created a corporate-user specific view so they could see information that was the most important to them. They had visibility and access into the granular details of the farmer and it's field, but could skip that if they don't want to look.
Why it mattered
Transparency to overall progress of their farmers.
The problem
Farmers didn't have an overview of all their crops
What we did
Created a farmer-user specific view so they could quickly see how they were doing. Corporations now had visibility to how specific farmers were performing.
Why it mattered
Overview of data progress