Case study
giving devs more time to build, making less design decisions
Why they brought us in
The product had product-market fit. Engineers were shipping features, handling the design decisions. They had revenue and customers coming in.
But the product was outgrowing their MVP design. They had several ideas for new features down the pipeline (no pun intended).
As their company matured, their product UI and experience didn't reflect the true growth they had.
The team needed someone to own the product experience, before tech debt and UX debt locked them into a product their growing customer base would outgrow.


Pigging is an art
Have you ever heard of pigging?
Pigging is a practice in the oil industry of sending special devices called "pigs" (Pipeline Inspection Gauges) through a pipeline in order to clean, inspect, and handle maintence. Piplelines can be buried 3-6 feet underground, often in very remote areas.
The pipes run through the lines without ever needing to dig up a pipeline.
The pigs hit checkpoints, which are used to tell how fast they are. (Remember physics class in high school? Speed equals distance divided by time) Knowing the speed can tell us how healthy the line is.
Replacing a pipe could cost millions, and not catching a tear in the line is disastrous for the environment, and a very expensive mistake for the company. So it is very important to get this right.
Historically, people would literally drive in trucks from checkpoint and listen on the ground for when the pig was passing, guestimate on their watch, and then drive to the next location.
This software brings that to the modern world.
They are juggling very important information, and sometimes managing multiple lines at once.
Data needs to be presented in a very specific way, prioritized for how operators think quickly and what they need to make gameday decisions.
What PigTracks does
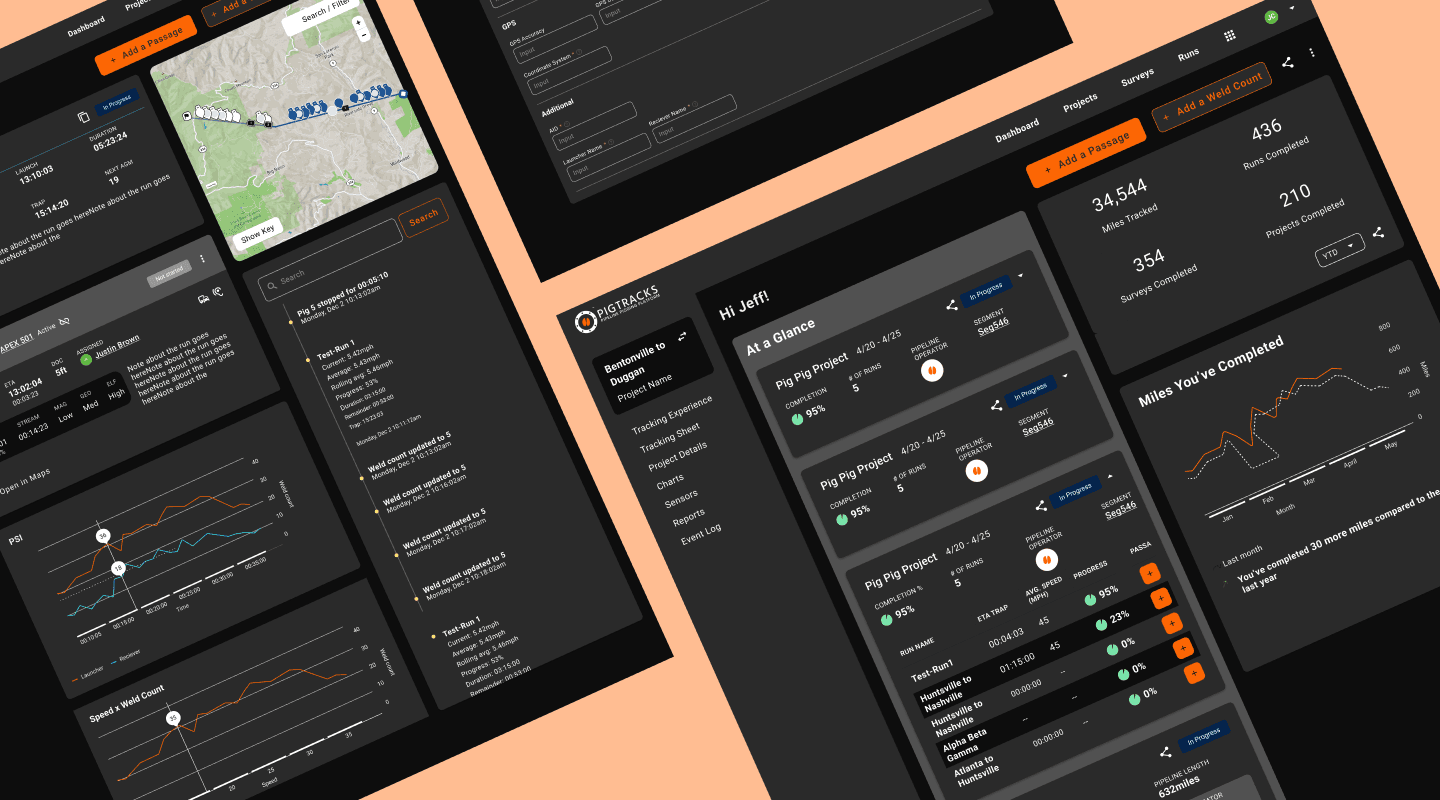
Pigtracks streamlines pipeline operations with automated data collection and reporting. The platform puts priorities for the operators in one place so they can make informed game-time decisions, which reduced manual effort and chance or errors.
Design Features
Real-Time Data Validation at Upload
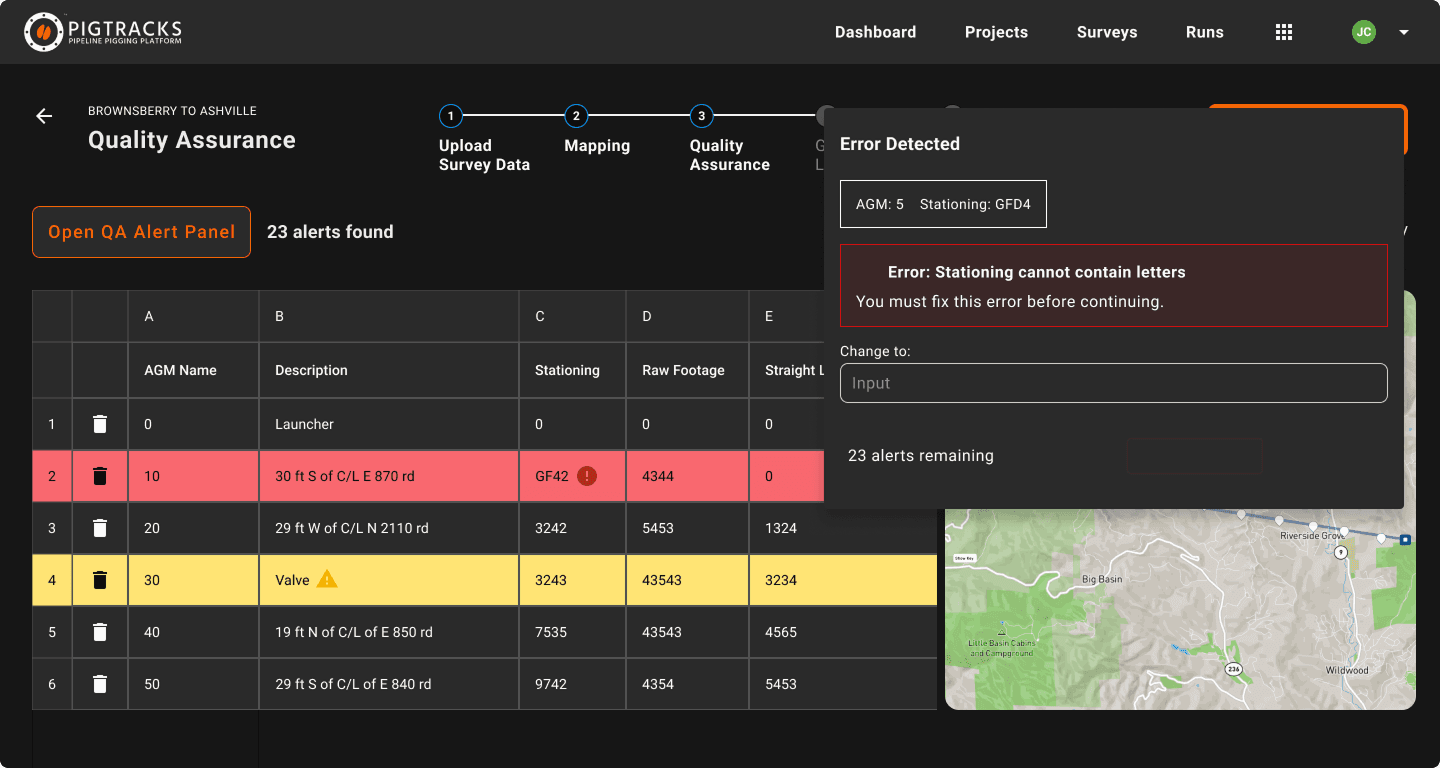
We rebuilt the survey upload flow so data validation happens immediately — at the moment of upload, not later in the pipeline (literally).
User Insight: Pipeline survey data is collected in the field, often by techs juggling weather, schedules, and equipment. By the time the data hits the platform, the original conditions are gone , there's no going back to re-collect. If errors aren't caught at upload, they cascade into bad reports, missed signals, and silent failures that operators only discover when something goes wrong.
Why it mattered: Submission errors dropped from 10-15% to near-zero. QA overhead shrank. Operators trusted their data instead of second-guessing it.
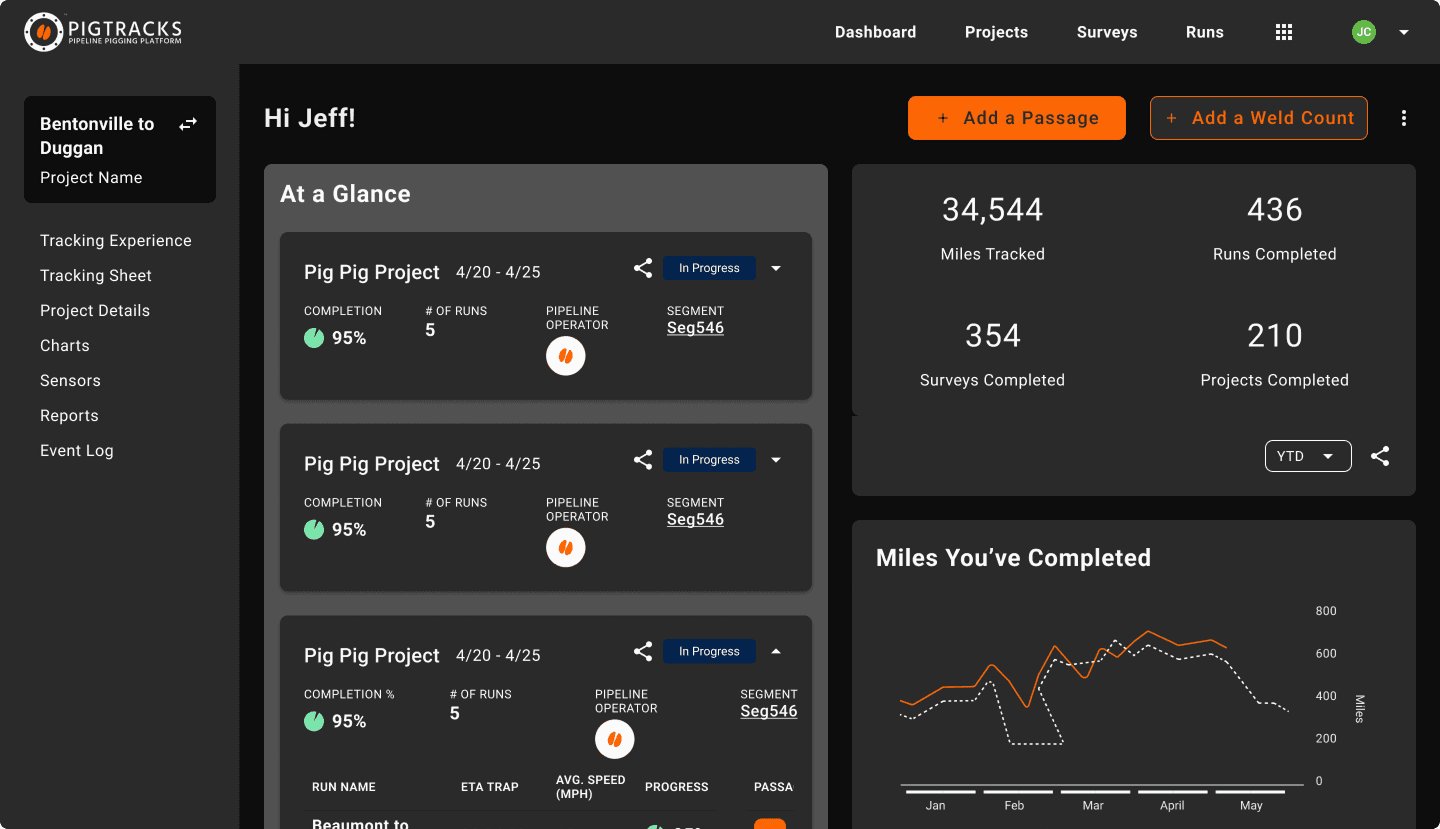
Operator-Centric Dashboard
We redesigned the active projects view to prioritize clarity of state over information density, even when more data was available.
User Insight: Operators monitor dozens of projects at any time, often shifting attention between them throughout the day. The dashboard isn't the place to absorb information — it's the place to triage. "What needs my attention right now?" is the only question that matters on this screen. Everything else is a detail page.
Why it mattered: Operators stopped wading through raw data to find what required action. Decision fatigue dropped. Time-to-action shortened.
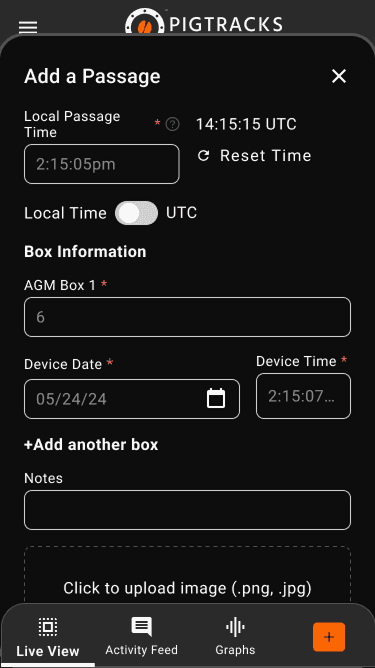
Omni-Present "Add a Passage" Action
We designed a persistent side-panel action that lets operators add a passage from any page — without losing context on what they were monitoring.
User Insight: "Adding a passage" is one of the most frequent and time-sensitive actions an operator does — but it doesn't happen in isolation. They're often watching live data update across other projects when a passage needs to be logged. A traditional "go to passage page, fill it out, navigate back" pattern meant losing real-time visibility. The omni-present action solved that.
Why it mattered: Documentation happens in the flow of work, not in spite of it.
Outcomes
10-15% to near-zero
in submission errors
205%
platform growth in 2024. Miles tracked grew from 2500 in 2022 to 29,000
60%
revenue increase in 2024
Design System established
for long-term design consistency